Baromètre de la transformation du secteur de l’assurance
Découvrez la toute première édition du baromètre de la transformation du secteur de l’assurance.
Reports
A Clearwater research insight, August 2025
By Matthew Vegari
Since 2023, corporate investors have by and large increased the duration of their portfolios as the Federal Reserve hiked, and then eased, its policy rate. Unsurprisingly, across Clearwater’s database and as noted in a prior post, longer duration portfolios have outperformed shorter ones by nearly a full percentage point. But the lesson to be learned is not that longer duration investments are always better (see 2021-22, when bonds were pummeled). Rather, the crux of effective, high-performance corporate investing is dynamism.
A concrete example: as corporates are limited in their portfolio flexibility (many are unable to invest in equities or corporate bonds, for instance), cash allocations can have a pronounced effect on performance. Thus far in 2025, top performers have held a cash allocation near 15%. Just three years ago, top performance required a 75% cash allocation, per the chart below.
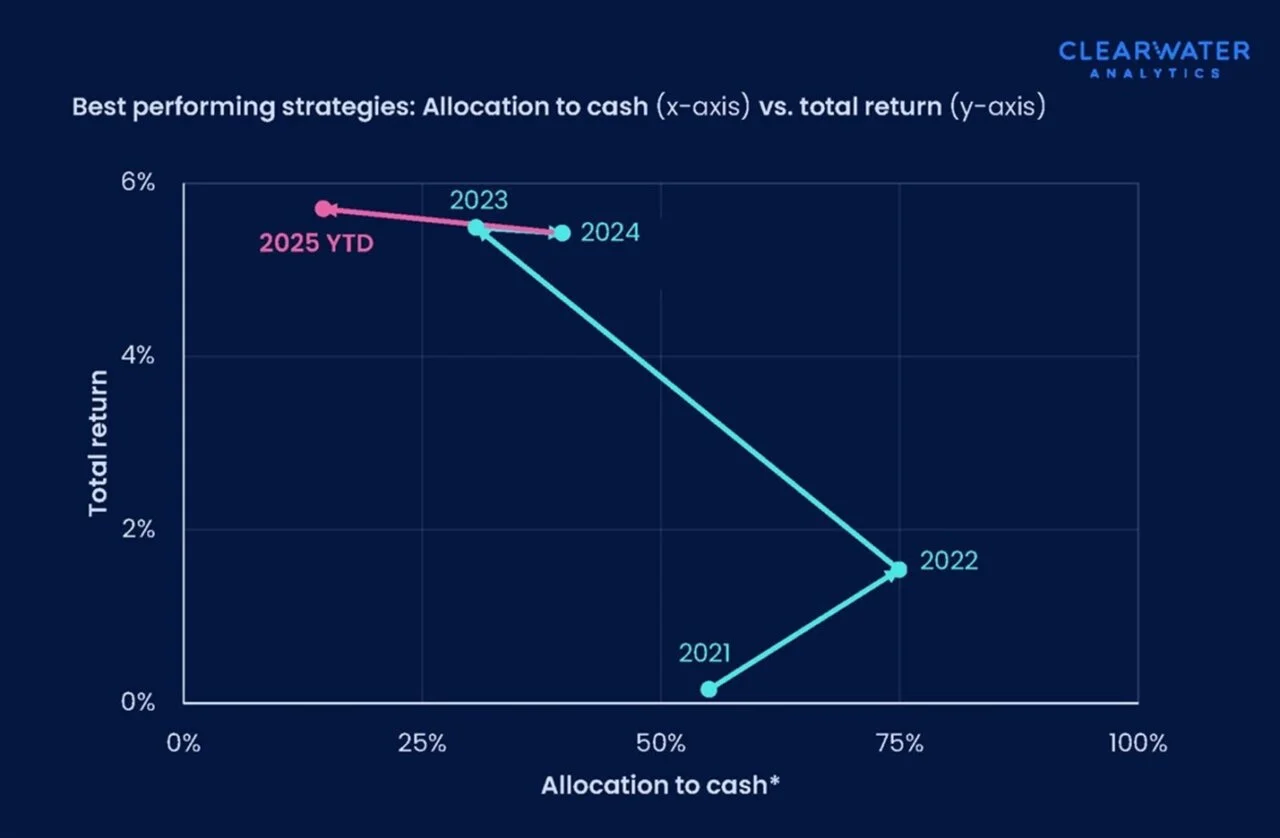
Figure 1: Best performing corporate investment strategies comparing allocation to cash (x-axis) versus total return (y-axis). Note: Cash and equivalent. For top 10% best performers (total return). Includes clients with $50M+ in assets under management, <=90% allocated to cash (and equivalents), <=10% allocated to equities, with extreme outliers removed. 2025 data is annualized through 5/2025. Source: Clearwater Analytics
Outperformers have rotated between cash, short-term, and longer-term instruments in response to the Fed’s hiking cycle, gradually building a strong ladder of duration. Beyond US Treasuries, they also added more corporate bonds to their portfolios in search of yield. In the chart below, note the rise and fall of short-dated assets.
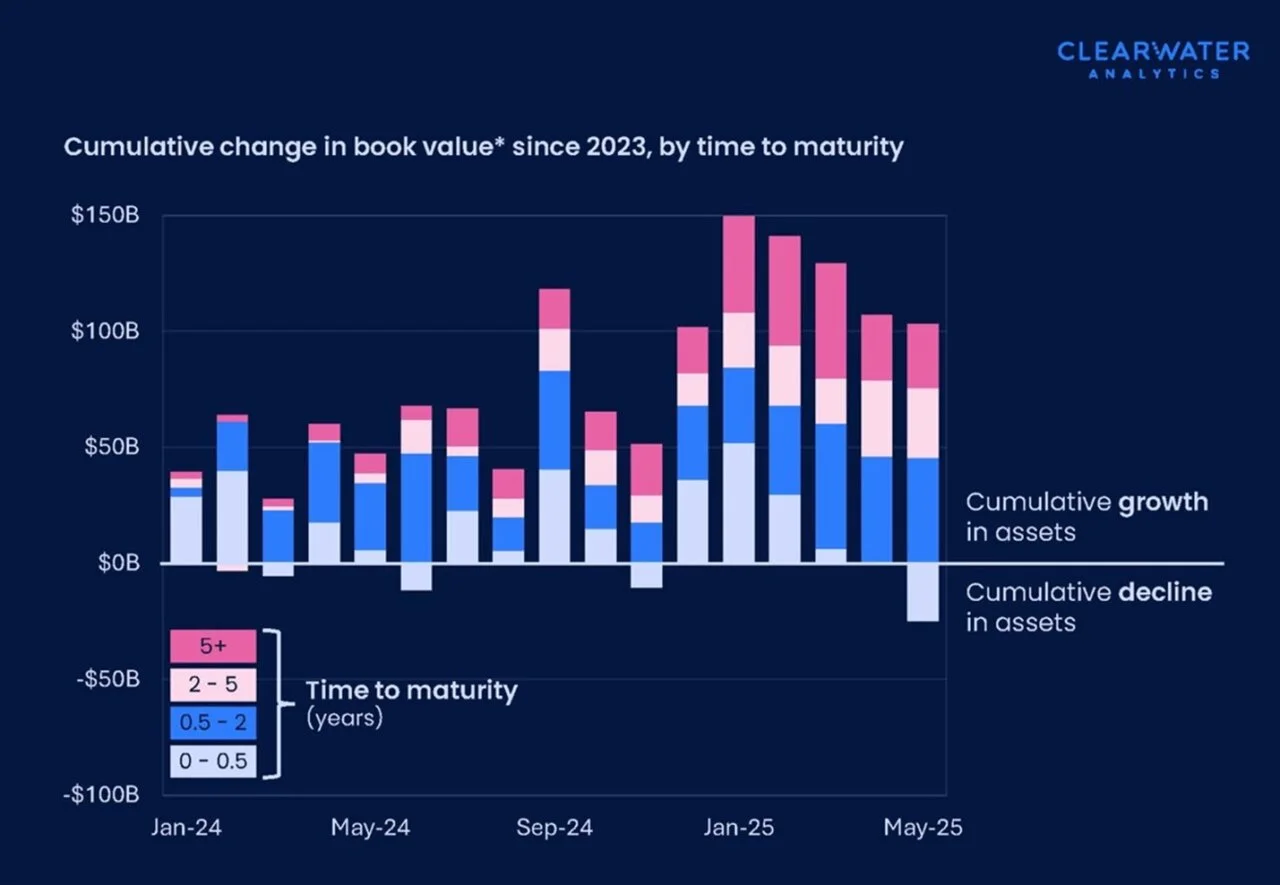
Figure 2: Cumulative change in book value of corporate investments since 2023, by time to maturity. Note: For those Clearwater corporate clients present on 12/31/2023, with >$50M in assets and <= 90% allocated to cash. Source: Clearwater Analytics
Is duration here to stay? For the time being, almost certainly, though we should be careful not to over-index outcomes for cash on what the market is pricing in months ahead. If we look at the market’s expectation for the fed funds rate over time, most of the implied rate changes were overly dovish during the Fed’s hiking cycle, especially in late 2023 through the first half of 2024. That shifted towards hawkishness, though the Fed subsequently eased. Recent pricing has whipsawed yet again after July’s jobs report.
Today, labor market softness combined with tariff-induced price pressures make the near-term macroeconomic outlook cloudy. Such uncertainty makes the Fed’s policy path less assured. Unless things turn south very quickly (not our base case), however, expect a gradual decline in rates as the Fed tries to balance risks in the labor market against risks to its inflation mandate.
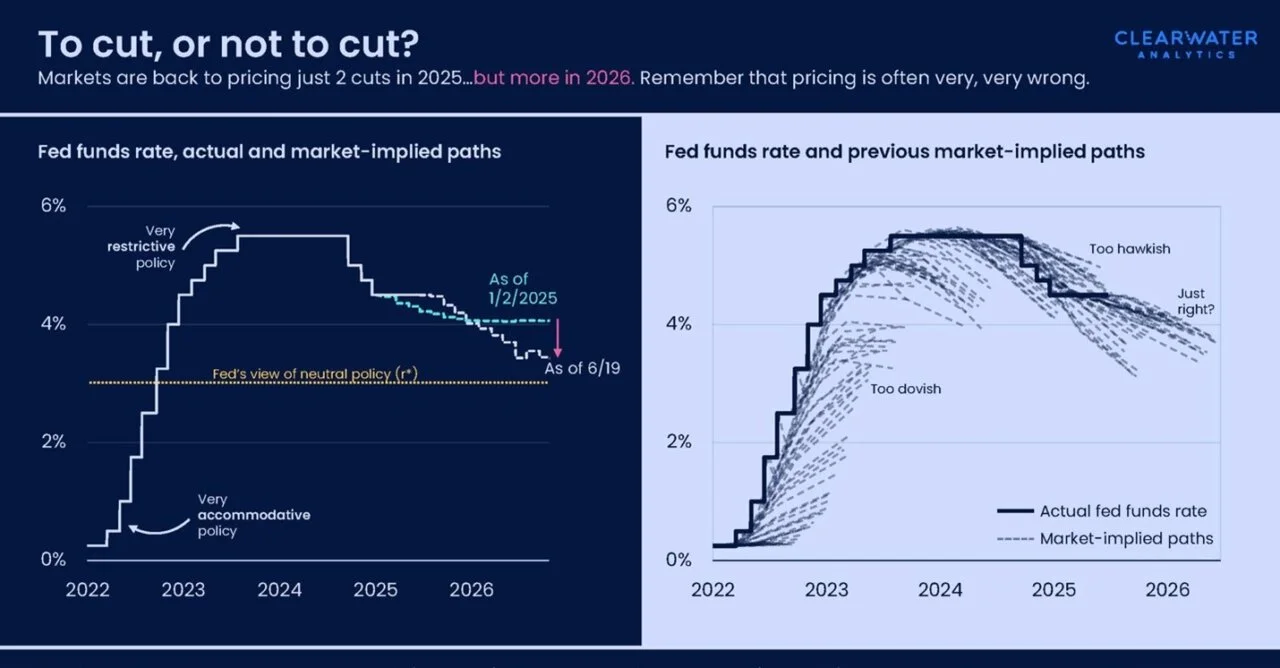
Figure 3: Fed funds rate and market-implied paths 2022 to 2026. Note: For the fed funds rate upper bound. Left through 10/2026; right (using rolling fed funds futures contracts) through 6/2026. R* = FOMC long-run median estimate.
For leading corporate investors, being responsive to monetary policy shifts – reducing cash exposure when rates peak and adding duration as cuts begin – has maximized returns. As markets continue to digest tariff announcements and other macroeconomic data prints, ongoing monitoring and dynamic, tactical shifts are essential.
If you are interested in the details of this analysis and additional insight on corporate treasuries and investments, download our Midyear macro update for corporates | The economy that wants to hang on.
This midyear macro update for corporates is based on a comprehensive review of the recent history of corporate investment performance, using Clearwater’s proprietary data. Data from about 800 corporate clients, with a combined $1.3 trillion in assets, was anonymized, analyzed, and compared for statistics such as total returns, asset allocations, and net flows.