Les 4 grands défis des investissements non cotés
Le non coté pose des défis uniques en matière de gestion, d'accès, d'interaction avec la donnée. Découvrez les 4 grands défis des investissements non cotés.
2 min read
Blog
In the corporate world, efficiency is key. This blog post delves into the specifics of how we developed an efficient, auto-scaling approach to our batch processes. We explore queue-based scaling, complications that can arise during implementation, and provide practical examples to show how we are able to optimize operations while keeping costs in check.
At Clearwater, we have a service for batch processing called our ETL (Extract Transform Load) system, which processes about 6–8 million tasks each day. The hardware requirements for each task vary wildly from a single GB of memory, all the way to hundreds, and runtimes go from seconds to hours. The most predictable part of this process is the timing of the load. The vast majority of our processing happens in the morning hours, with afternoons being very light to almost idle. As an investment reporting company that processes massive volumes of accounting data, the only exception to this is around “month ends” (the first 5 days of a month) when most of our clients “lock down” their accounting information and generate reports for legal filing purposes, board reporting, etc. During this time, our load spreads out more into the afternoon.
Recently, we had the opportunity to migrate our applications from running on-prem in a data center to the cloud. This was quite the paradigm shift for how we handled load. Formerly, on-prem, we could simply (note to reader: laugh at “simply” here) buy as much hardware as we needed to handle our peak load and it would be ready for that load 24/7.
In the cloud, however, reserving all the EC2 instances we need, even when there is no demand for them, is a very costly process. By design, of course. Unlike running in an on-prem environment, a major advantage to running in the cloud is the ability to scale to meet any given moment’s needs. We only needed to make some adjustments to take advantage of this incredible flexibility.
Since our load had a somewhat predictable pattern to it, we were able to quickly alleviate a lot of the cost of running the ETLs by implementing scheduled scaling. Problem solved? Not yet. This had an interesting consequence: while our load was semi-predictable, it seemed to have a life of its own and would change almost weekly.
We’re a growing company; in business-speak: our revenue is growing 25%+ a year with a Net Revenue Retention (NRR) rate of 116%. Keeping up with new clients, their changing accounting and investment strategies, data delays, and overall software improvements (and regressions) meant we had to spend engineering resources to tweak and tune the schedule constantly so we can adapt to these changing conditions, with goal of maintaining our high SLA expectations.
Anyone still reading at this point should be shouting at their screen, telling us to just migrate to any of AWS’ approaches to auto-scaling. And they would be in exact agreement with what we were thinking too.
Alas, we tested scaling based off hardware utilization; it was wildly too unpredictable to rely on while maintaining our SLAs. Most of our tasks have high IO wait times, which results in the hardware going idle long enough to scale-in, only to rapidly increase in utilization as the IO completes and demands an immediate (though maybe unnecessary) scale-out. Meaning, our hardware utilization never matched our hardware needs.
Don’t forget about our long task runtimes. If you’re curious, we were able to successfully work around that; you can read about it in this blog: Scaling In With Long Running Processes on AWS.
What we really wanted this whole time was to be able to scale off our task queue depth. If you’re familiar with it, this is the same concept as using KEDA in EKS/ECS: push a custom metric to CloudWatch and use it to determine if we should scale-in/out. Unfortunately, we’re not running in EKS; we’re running on EC2. So, we had to re-invent the wheel a bit. Thankfully, AWS has recommendations on how to scale based off SQS queue depth that we were able to make use of in our design. Also, to answer one of your questions: we do have technical reasons for not running this system in EKS, but that is a story for another day.
Putting all the concepts together was easy enough (see following diagram). Implementing them was when the real fun began (see the following sections).
Zoom image will be displayed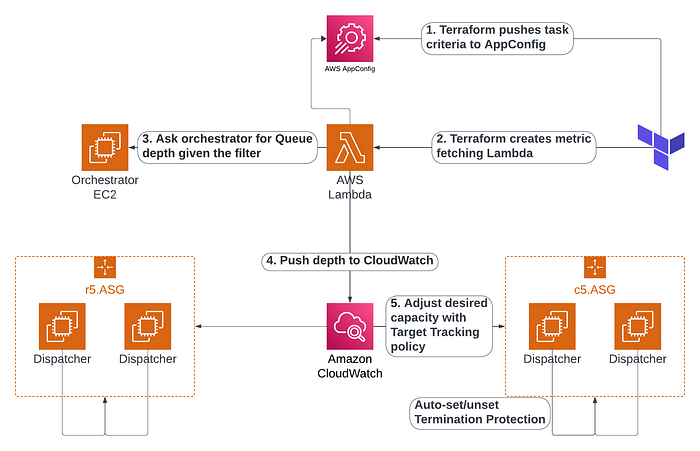
Given the breadth of variety we have in our task characteristics, we had to create several ASG configurations in AWS to support some bucketed needs while minimizing cost. As such, we can’t just push one queue depth to CloudWatch; we must push many. Hence, the presence of 2 ASGs in the diagram above. Though, more exist in reality.
To support this properly, each ASG must know the “class” of tasks it can run. The “class” is a composite of several task characteristics such as:
These characteristics form what we call our “filter criteria” that is used for selecting tasks to run.
Each ASG then pulls its own filter criteria from a dedicated space in AppConfig and the same Terraform project we publish the ASG/AppConfig with also publishes the metric fetching Lambda. This made it easy to copy the filter criteria and pass it to the Lambda via the Lambda’s environment to avoid paying extra to store the criteria anywhere else.
Terraform handled this nicely. We make liberal use of modules as an organization construct within Terraform. Within the module that manages creating our ASGs and their associated AppConfig, we define an input variable like:
variable "environment_variables" {
  type        = map(string)
  description = "ASG-level environment variables to set on instances"
  default     = {}
}
Within the module for the metrics Lambda then, we define another variable:
variable "asg_configuration" {
  type = map(object({
    name        = string
    environment = optional(map(string))
  }))
}
And as a result, we can pass the exact same Map data to the two different modules and the Lambda will only get the 2 keys that were defined in the schema for it! Easy win.
Unfortunately, we quickly realized that the 4KB limit on the environment size in Lambdas was not enough to hold the filter criteria for every ASG in existence. While this sounds outrageous, our real roadblock was how we support 30+ task types and wanted to limit ASGs to running subsets of the task types for cost attribution purposes. The string names for the task types multiplied by the number of ASGs and the JSON encoding quickly added up.
As a workaround, we settled on storing the information in a second, Lambda-specific location in AppConfig instead. While this resulted in a minor added cost (estimated $173/mo. to query every 1min; depending on Lambda uptime), this allows us to be really verbose (or precise, depending on perspective) with our ASG configurations.
To make this work, our top-level module definition didn’t have to change at all. The same input variable trick worked. We just had to pipe that variable to AppConfig instead of setting it on the Lambda. Super easy win.
The metrics we publish to CloudWatch from the Lambda then, are simple:
To help minimize cost, we even batch-pushed the metrics to CloudWatch. In Python with Boto3, this looks roughly like:
import boto3
import logging
from datetime import datetime, timezone
import threading

class CloudWatchMetricsPublisher:
    def __init__(self, namespace: str):
        self.namespace = namespace
        self.CloudWatch_client = boto3.client('CloudWatch')
        self.metrics_buffer = []
        self.lock = threading.Lock()

    def publish_metric(self, metric_type: str, asg_name: str, realm: str, value: float, unit: str):
        metric_data = {
            'MetricName': f'{metric_type}_{asg_name}',
            'Unit': unit,
            'Value': value,
            'Timestamp': datetime.now(timezone.utc),
        }
        with self.lock:
            self.metrics_buffer.append(metric_data)

    def flush_metrics(self):
        """Publish all buffered metrics to CloudWatch."""
        with self.lock:
            if not self.metrics_buffer:
                return  # nothing to publish
            try:
                response = self.CloudWatch_client.put_metric_data(
                    MetricData=self.metrics_buffer,
                    Namespace=self.namespace
                )
                logging.info(f'Successfully published {len(self.metrics_buffer)} metrics: {response}')
            except Exception:
                logging.error('Failed to publish metrics', exc_info=True)
            finally:
                # Clear the buffer after publishing
                self.metrics_buffer.clear()
We now had metrics flowing through to CloudWatch. We just had to do something with them. For that something, we settled on employing a target tracking policy with metric math. The rough goals being:
Meeting the first goal for scaling-out was initially easy.
What we learned along the way, though, was that target tracking can sometimes scale-out very aggressively if you’re not careful.
First, if you set the scaling_target to something low, like 1, and the result of your metric math increases rapidly, then the ASG will scale out more rapidly to combat perceived spike in load.
Zoom image will be displayed
This can happen if you intentionally neglect to take instance counts into consideration with the metric math. E.g.
IF(FILL(queue_depth,REPEAT) > 0, FILL(queue_depth,REPEAT) + 1, 0)
This was done for our ASG that handles the near-500GB tasks because we really need a whole instance per-task. But, as said, the fix was simple:
IF(FILL(queue_depth,REPEAT) > 0, FILL(queue_depth,REPEAT) /
FILL(instance_count,REPEAT) + 1, 0)
Second, for our smaller ASGs, we had our default instance warmup misconfigured. With scheduled scaling, this wasn’t an important knob to pay attention to. With auto-scaling, it makes a world of difference! As they say in the docs:
You can specify how long after an instance reaches the InService state it waits before contributing usage data to the aggregated metrics. This specified time is called the default instance warmup. This keeps dynamic scaling from being affected by metrics for individual instances that aren’t yet handling application traffic and that might be experiencing temporarily high usage of compute resources.
By changing the value from a quick 10 seconds to several minutes (based on measured boot times) we were able to get our smaller ASGs to scale-out in a much more predictable fashion as well.
Scaling-in then, was a more interesting challenge. AWS laid out the algorithm nicely (as seen in an earlier link):
while (true)
{
  SetInstanceProtection(False);
  Work = GetNextWorkUnit();
  SetInstanceProtection(True);
  ProcessWorkUnit(Work);
  SetInstanceProtection(False);
}
But, we wanted to take this to the next level. Our requirements:
1. We don’t have one task running at a time on single instance; we potentially have hundreds running concurrently.
2. There are times where we can “infer” that a task will run for a protracted period, and other times, we can’t make that inference.
3. “Flapping” needed to be minimized. Meaning: to reduce unnecessary API interactions with the ASG, an instance should remain protected for as long as possible or unprotected. It should not rapidly alternate under any circumstances.
So, we developed a framework whereby each ASG can be configured based on the observed need of the ASG.
Our near-500GB task size ASGs could be configured based on the exact memory requirements of the tasks that are executing. We’ve observed that tasks over a certain threshold run for long enough that we should turn on instance protection. Conversely, smaller tasks complete fast enough that protection is not strictly necessary.
Our smaller ASGs then, we just wanted to minimize noise on. So, we decided that if X-number of tasks were running, then we would elect to protect that instance from termination with the idea that a less busy instance would be terminated first.
Zoom image will be displayed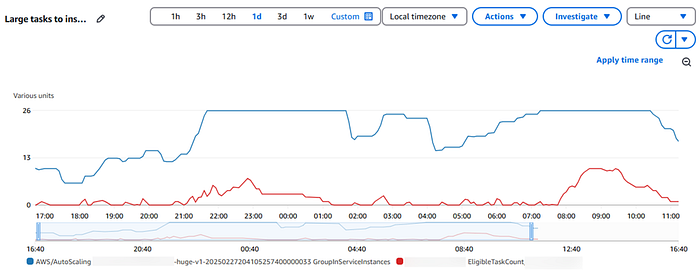
Overall, we are quite satisfied. As you can see from the above, our 500GB ASG is scaling-out as tasks come in and scaling-in as they complete. Additionally, our cost for running EC2 instances dropped by ~32% over the course of a week when compared to our scheduled scaling approach.
The results shown above speak for themselves and highlight the success of this project. However, in testing, particularly in less frequently used (and therefore not as well-tuned) environments we’ve found at least one issue with our approach. Namely: if one task comes in that requires most of an instance and leaves no room for anything else to run, then every other task will sit in the queue. If the queue doesn’t get deep enough, which is not likely in a low-utilization environment, then we won’t scale-out to get the other tasks in the queue processing.
In time, we hope to explore some of the following concepts and see if we can resolve this issue:
A nice aspect of having all traffic driven to an instance from a queue instead of HTTP is that you can “very easily” scale to zero. When doing so, I offer a word of caution: make sure the metric you track with target tracking can account for having zero instances appropriately. And I don’t mean account for dividing by zero.
Target tracking is a great way to get up and running with auto-scaling quickly. As long as you bend to its will. Namely:
With a sanely calculated scaling_target (typically not 1) like 50, it can be quite hard to get a single task running. This is very similar in concept to the future improvement discussed above but with a relatively easy solution:
metrics {
  id    = "instances"
  label = "Current running instance count for ${local.asg_name}"
  metric_stat {
    metric {
      dimensions {
        name  = "AutoScalingGroupName"
        value = module.asg.autoscaling_group_name
      }
      metric_name = "GroupInServiceInstances"
      namespace   = "AWS/AutoScaling"
    }
    stat = "Average"
  }
  return_data = false
}

metrics {
  id    = "scaling_target"
  label = "The defined target to use for scaling thresholds in ${local.asg_name}"
  expression   = "TIME_SERIES(${var.scaling_target})"
  return_data  = false
}

metrics {
  id    = "eligible_tasks_per_instance"
  label = "Eligible Tasks / Num Instances (rounded up to 1 to avoid dividing by 0) in ${local.asg_name}"
  expression = "FILL(eligible_tasks,REPEAT) / IF(FILL(instances,REPEAT) <= 0, 1, FILL(instances,REPEAT))"
  return_data = false
}

metrics {
  expression = "IF(FILL(instances,REPEAT) == 0, scaling_target + IF(FILL(eligible_tasks,REPEAT) > 0, 1, 0), IF(FILL(instances,REPEAT) == 1 && FILL(eligible_tasks,REPEAT) > 0 && FILL(eligible_tasks,REPEAT) < scaling_target, scaling_target, eligible_tasks_per_instance))"
  id         = "scaling_ratio"
  label      = "Scaling ratio for ${local.asg_name}"
  return_data = true  # This is the metric we will be scaling off of
}
There’s a lot to take in here. But, in short:
# Having zero instances and forcing the scale-out.
IF(FILL(instances,REPEAT) == 0

# Having one instance and maintaining it.
IF(FILL(instances,REPEAT) == 1 && FILL(eligible_tasks,REPEAT) > 0
&& FILL(eligible_tasks,REPEAT) < scaling_target

# Having multiple instances and scaling as normal.
eligible_tasks_per_instance
There are a lot of ways to scale an app in the cloud to meet the demands of your users. Here are my three takeaways:
Just remember, the learning never stops; you might stumble upon a scenario that you hadn’t considered or didn’t even know existed.
Craig Hecock is a Principal Engineer at Clearwater Analytics with over 15 years of experience in software development. With a comprehensive background spanning front-end, back-end, and working on both SQL/NoSQL databases, he has a proven track record in triaging and debugging complex issues. Craig is passionate about leveraging technology to solve complex problems and improve user experiences. Aside from working on code, Craig is a strong advocate for team growth, enjoys mentoring others and helping them develop their skills as developers.